Disclaimer:
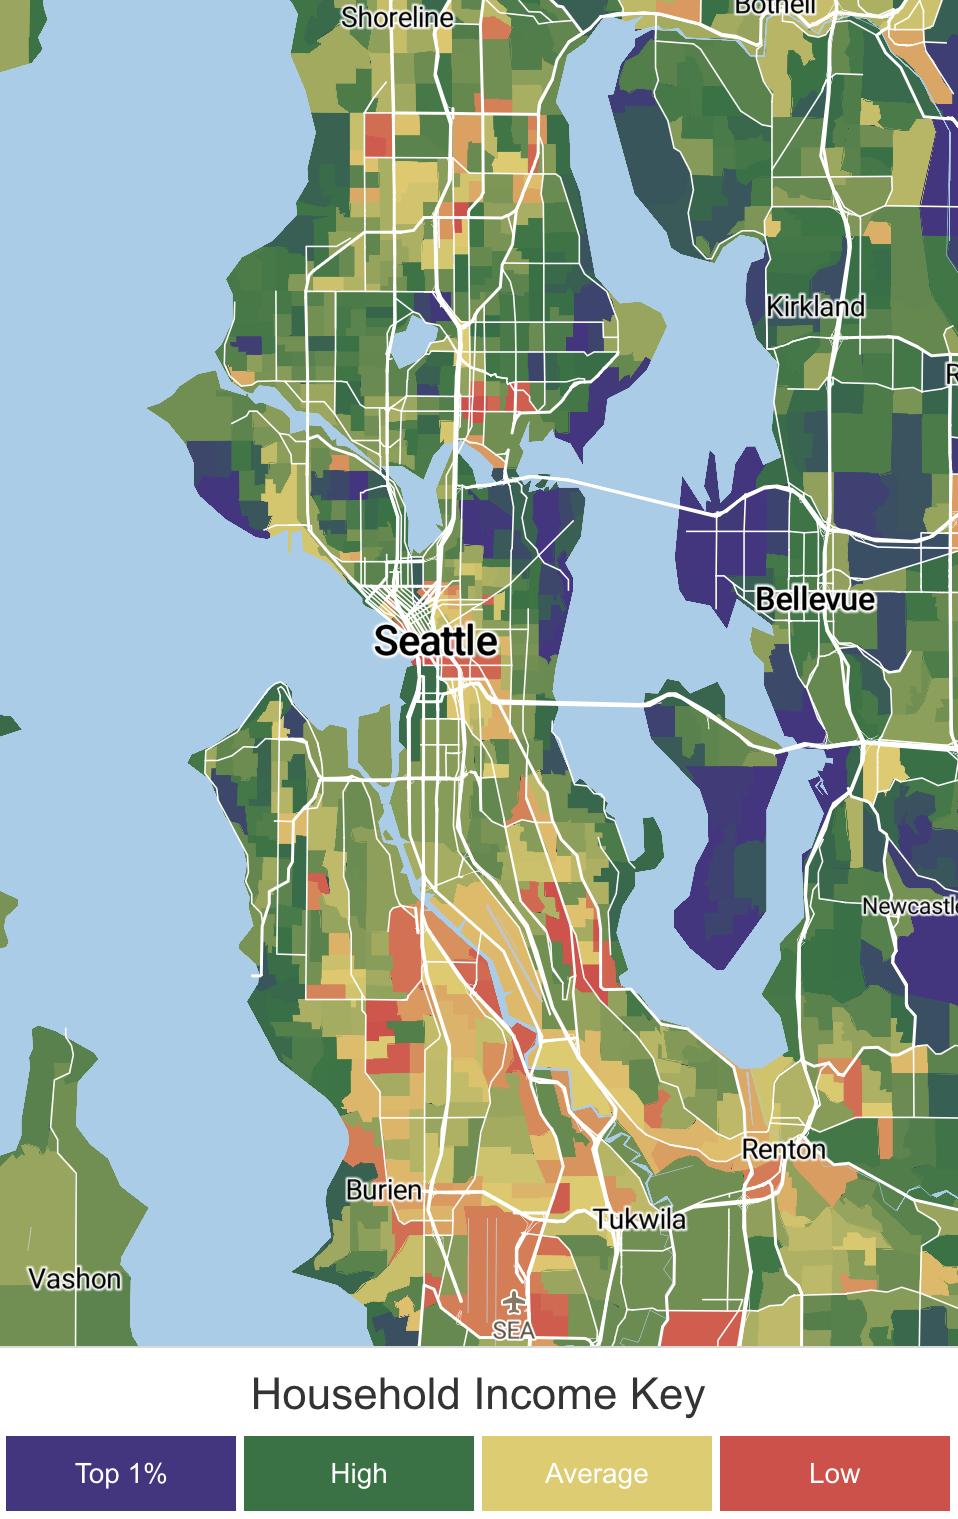
Data is collected from the Seattle Open Data Portal (SPD). This site will allow users to view data from 2018 to 2023. In addition, users can customize how the data is presented, from year, income and crime type. The data SPD relied on the National Incident-Based Reporting System for the data. The Median Income Map was gathered from a website called Best Neighborhood.
Click Anywhere to Go Back.